Welcome to our eighth edition on everything related to impact data. In this newsletter, we explore how satellite-based indices monitor forest health, introduce a graphical interface for seamless Earth Observation data discovery, examine a new roadmap for real-time welfare tracking, and highlight a massive 60 TB dataset that is transforming how AI “reads” our planet.
In this newsletter, we cover:
- Interesting Variable: Forest Condition Anomaly (FCA) Index
- Interesting Tool: CDSE STAC Browser
- Interesting Read: “Measuring Welfare When It Matters Most”
- Interesting Dataset: Global Embedding Dataset
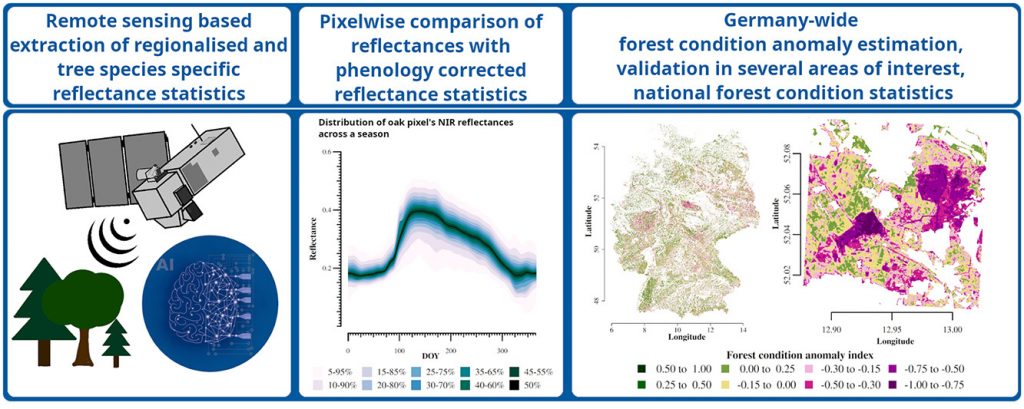
Interesting Variable: Forest Condition Anomaly (FCA) Index
In previous versions we have looked at the distribution of wastewater plants and the high-resolution mapping of European farm density. We now turn to a critical ecological metric: the Forest Condition Anomaly (FCA) Index. This similarity metric is specifically designed to monitor forest health across Germany by comparing tree species-specific reflectance time series from Sentinel-2 satellites against a reference seasonal evolution.
The resulting data provides a scale from -1 to 1, where negative values act as a warning sign for declining health, indicating reduced chlorophyll, lower water content, or crown defoliation. Research has established that a value falling below -0.15 serves as a reliable threshold for identifying forest stands that are heavily damaged or dead, providing a clear, data-driven trigger for conservation intervention. The image below gives a good indication of the methodology.
Interesting Tool: CDSE STAC Browser
The CDSE STAC Browser is a nice tool. It provides a graphical user interface (GUI) that simplifies how we can explore and filter global data. You can navigate vast catalogs of standardized metadata without the need for complex coding, it makes planetary intelligence accessible through intuitive interactive maps and temporal sliders. This approach is comparable to Overpass Turbo or the World Bank DataBank, which similarly empower users to build custom queries and visualize data with ease.
For researchers and journalists, the browser’s utility extends into specialized applications like false color manipulation. By assigning invisible data to visible color channels, users can render environmental phenomena like flood zones or burn scars clearly visible to the human eye. This ability to transform raw satellite signals into actionable visual intelligence is a crucial step in monitoring global impacts, mirroring the advanced ship spotting and oil spill detection techniques we have explored in previous editions.
Interesting Read: Measuring Welfare When It Matters Most
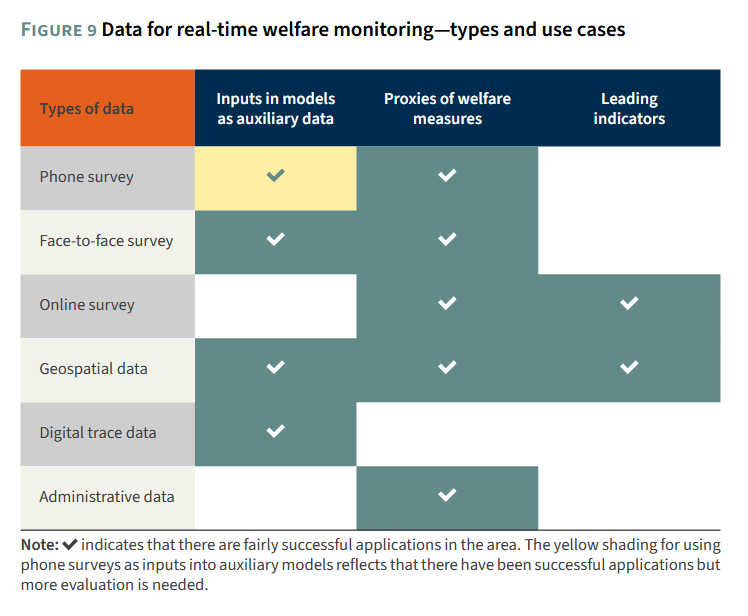
Following our discussion in Newsletter #7 regarding societal resilience during conflict, this World Bank publication analyzes the technical architecture required for such monitoring. The report, authored by Kimberly Bolch, Maria Eugenia Genoni and Henry Stemmler, addresses the critical challenge of policymakers “flying blind” when traditional household surveys which often have lags of five years or more become outdated during rapid-onset crises like pandemics or climate disasters. It provides a comprehensive typology of approaches for real-time monitoring, creating a roadmap that bridges the gap between old “baseline” data and high-frequency “auxiliary” data.
The core message of the report is that while cutting-edge AI and “big data” sources such as nighttime lights, mobile phone metadata (CDR), and satellite imagery can provide high-resolution snapshots of wealth and poverty, they are not a replacement for traditional methods. Instead, the goal is to make household surveys “smarter and more connected”. By using surveys as the “training data” for machine learning models, practitioners can generate more frequent and granular insights, transforming static records into an adaptive, real-time feedback loop for evidence-based policy.
Interesting Dataset: Global Embedding Dataset
Building on our previous exploration of massive, interoperable datasets like the Foursquare OS Places 100M and the LUMIERE cinema database, we now highlight a significant leap in planetary-scale AI: the Global Embedding Dataset. Hosted on the Copernicus Data Space Ecosystem (CDSE), this staggering 60 TB collection provides AI-ready satellite information derived from both multi-spectral and Sentinel-1 SAR (radar) imagery. By utilizing the highly efficient GeoParquet format, the dataset is purpose-built to streamline geospatial pipelines, allowing for the rapid processing of immense quantities of Earth Observation data.
The true power of this resource lies in its use of embeddings that are high-dimensional latent vectors that capture the essential spatial and contextual characteristics of the Earth’s surface. These vectors make the data perfect for sophisticated machine learning tasks, such as automated land classification. To understand this concept, think of a traditional satellite image as a dense, multi-page book describing a landscape in exhaustive detail; an embedding is like a concise, one-paragraph summary of that book. While much smaller and easier for a computer to handle, this summary retains all the critical information, allowing an algorithm to “read” and compare thousands of global landscapes simultaneously with far greater speed than analyzing every original page.