Welcome to our ninth edition on everything related to society and impact. We explore how granular data reveals climate vulnerability, how AI agents are automating map storytelling, the precarious state of global health funding, and the massive survey efforts that underpin our understanding of health and mortality.
In this newsletter, we cover:
- Interesting Variable: Subnational Vulnerability Index (SGVI)
- Interesting Tool: MapStory
- Interesting Read: The Fragile Foundations of Global Health Data
- Interesting Dataset: Demographic and Health Surveys (DHS)
Interesting Variable: Subnational Vulnerability Index (SGVI)
Data tends to be national averages. For example, if you look at poverty rates, GDP forecasts or SDG achievements, you will get national averages. However, most of the time you are interested in a more granular view. We face the issues when we look at forecasts for EU Member States based on data provided by the European Commission.
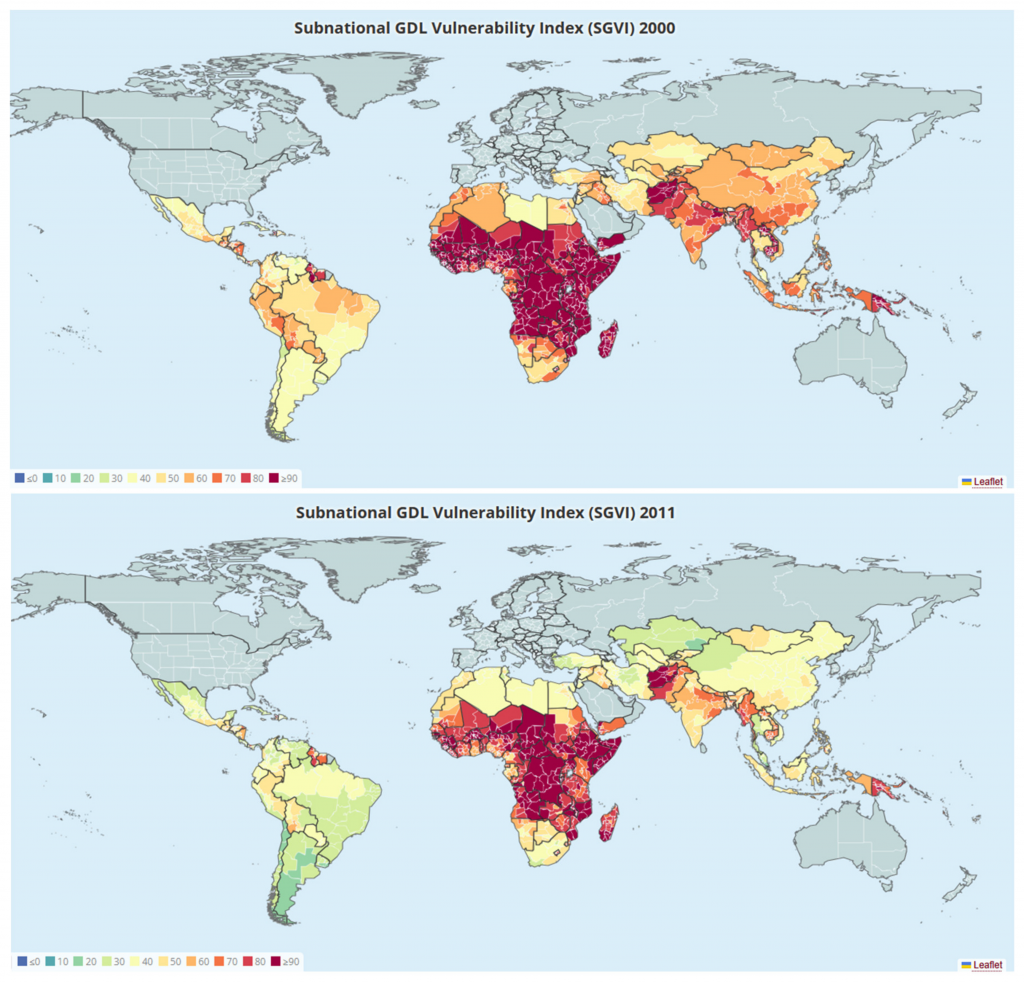
The Subnational Vulnerability Index (SGVI) is a data-driven measure designed to monitor the human dimensions of vulnerability to climate change and natural disasters. It is described in a paper titled “From National Averages to Local Realities: A Subnational Vulnerability Index to Guide Sustainable Development in Low- and Middle-Income Countries” developed by Jeroen Smits and Janine Huisman. Unlike traditional indices that focus only on national averages, the SGVI reveals localized disparities in coping and adaptive capacity which are often obscured by country-level statistics. The data covers 1,260 regions across 118 countries, providing a resolution ten times more detailed than previously available.
It aggregates eleven indicators across dimensions such as economy, health, governance, and infrastructure. This level of granularity is vital for identifying specific “hotspots.” For example, the data shows that in certain subnational regions, vulnerability can be 70% higher than the national figures suggest:
However, at the level of major regions, the increase in observed inequality is (much) higher and runs to over 70 percent in Sub-Saharan Africa (SSA), which highlights the importance of disaggregated data for targeted policy action.
Interesting Tool: MapStory
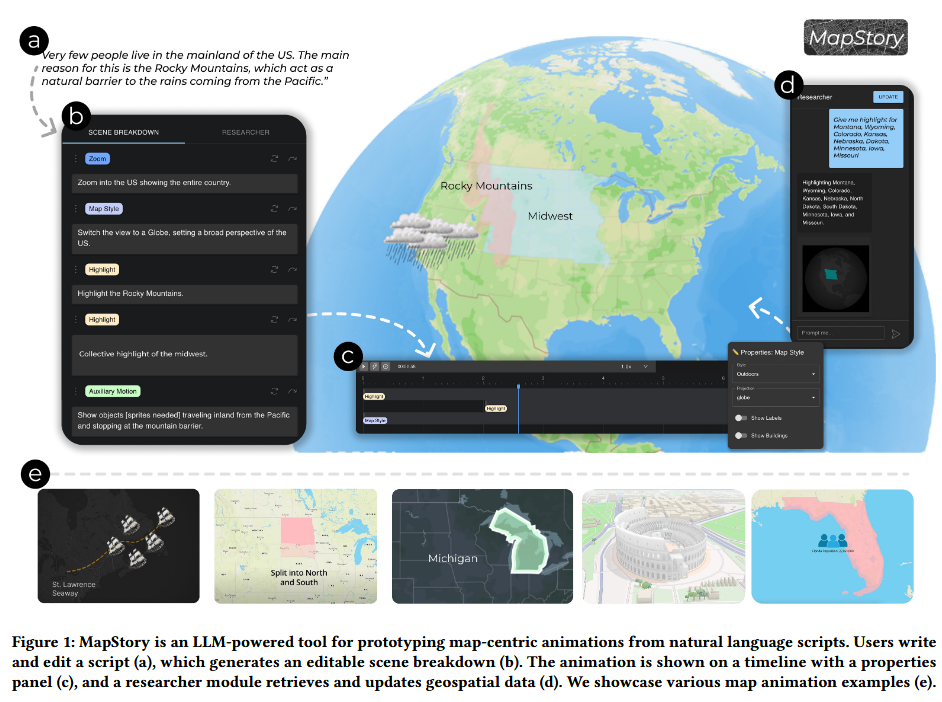
MapStory is an LLM-powered prototyping tool that allows users to create editable map animations directly from natural language scripts.
It effectively bridges the gap between scientific data analysis and high-level visual storytelling. The tool lowers the barrier for non-experts to visualize complex geographic narratives, such as migration patterns or historical changes, while maintaining fine-grained control through an interactive timeline.
Technically, it uses a dual-agent architecture:
- A “scene breakdown agent” that deconstructs text into animation primitives like camera movements and visual highlights.
- A “researcher agent” that retrieves factual geospatial data via web search.
This allows for a seamless transition from a text prompt to a visual, geospatial narrative.
Interesting Read: The Fragile Foundations of Global Health Data
Check out the podcast “The Fragile Foundations of Global Health Data” which explores the critical ecosystem of evidence-based grantmaking.
In this episode, GiveWell’s CEO Elie Hassenfeld and Senior Researcher Adam Salisbury discuss the Demographic and Health Surveys (DHS) program. They highlight the potential consequences of recent funding cuts to this program and how it creates significant challenges for tracking essential metrics. Just consider how you can get sensitive information such as family planning from women living in Northern Nigeria without visiting them in person.
The discussion serves as a stark reminder that without robust data infrastructure, we risk “flying blind” regarding key indicators like child mortality rates.
Interesting Dataset: Demographic and Health Surveys (DHS)
Building on the discussion above, the Demographic and Health Surveys (DHS) program provides one of the most reliable sources of global health data.
It is unique for its use of vast, in-person surveys where enumerators travel to remote areas to ask women for their children’s birth and survival histories. This method fills critical gaps where official registries fail to track basic metrics.
The data is foundational for constructing high-impact indices, including the SGVI mentioned earlier and various Sustainable Development Goal (SDG) trackers. It provides essential cluster-level data on wealth, health, and education.
Despite its high cost and logistical complexity, the DHS remains a primary source for mortality estimates in low- and middle-income countries and is an indispensable resource for researchers in the development sector.